Lindy's Five Essential Websites (Non-Major Media) for 2013
[+] Team Summaries

Friday, August 31, 2012

Finding home field advantage: turnovers

In previous posts I found that home teams in conference games have a .12 point per game advantage in field goal accuracy, a .16 point advantage from penalties, and a .175 point advantage from kickoffs. Total, home teams score 3.15 more points than road teams in these games, so increased field goal accuracy and reduced penalties can account for ~14% of home field advantage.

Turning to turnovers, road teams throw one interception per game on average and home teams throw .93 picks. Roads teams fumble 1.62 times per game and lose 50% while home teams fumble 1.59 times and lose  49%. On average, road teams turn the ball over one extra time every 10 games.

Assigning a point value to that one turnover every 10 games is a bit of a challenge. On average, teams lose by 7 points more/win by 7 fewer points every time they throw an interception, but part of that is because throwing interceptions is related to performance in other areas - e.g., pass protection or desperation at the end of a losing effort. If we adjust that number for the quality of the two teams overall, the point penalty for an interception drops from around 7 to somewhere between 3.5 and 4. For fumbles, the penalty is around 3. Given one extra turnover every 10 games, that would give home teams a .35 point advantage per game.

But we can do better than that. If we assign a point value to field position, down, distance and time remaining in the half, we can directly measure the point impact of a turnover. By that method, fumbles cost 3.49 points on average and interceptions 3.35 points. Given that one turnover advantage every ten games, that comes out to .359 points per game.

To review, of that 3.15 point advantage per game for playing at home, we have accounted for .12 points from increased field goal accuracy, .16 points from fewer penalties, .175 points from better kick coverage and returns, and .36 points for fewer turnovers.   Total, that comes out to .815 points per game or 26% of home field advantage.


Thursday, August 30, 2012

Picking FCS shockers, week 1

James Madison was 5-5 against FCS opponents in 2010.
But it was 1-0 against 2010 ACC champs
One of the fun things for me at the beginning of every football season is to see which FCS teams can take the paycheck, march into an FBS stadium and pick up a win. Few games are more memorable than when David knocks off Goliath; the shock waves from Appalachian State are still reverberating around Ann Arbor. But most FCS wins are really about a welterweight Goliath knocking off a heavyweight David, and it is these victories that I try to predict.

And week 1 offers some juicy match-ups for the diminutive Goliaths of college football. All told, FCS teams have a 75.6% chance of snagging at least one win against an FBS opponent in the first weekend. The best odds are on Eastern Washington, who struggled through 2011 but were national champions in 2010. They face what I believe will be a terrible Idaho team. Were Eastern Washington playing this one at home they would be favored. Indiana State also lost five games in 2011, but three of those losses came at the hands of 2011 FCS powerhouses UNI and North Dakota St and Penn St. They could make things interesting against Indiana. And South Dakota St. will try to repeat the performance of its neighbor to the north in 2010 and beat Kansas.

At the other end, MEAC doormat Savannah St. (17-88 since joining the FCS) gets Oklahoma St. OSU may have lost some key offensive skill position players, but I don't think that will catch up with them quite yet.

The most interesting game of the weekend by far is Wisconsin against Northern Iowa. UNI almost knocked off Iowa St. last year and Wisconsin will be breaking in a new quarterback. Wisconsin should win by four touchdowns, but Michigan and Virginia Tech should have as well.

[Ranking next to each team is division specific, FBS and FCS]


Wednesday, August 29, 2012

The 2012 preview you've been waiting for

I even dressed the part
Preseason statistical analyses are little more than a voodoo witch doctor reading sheep entrails while rubbing a crystal ball for luck. There are some measurables - returning starters, recruiting class rankings, etc. - that we can try to use, comparing these to benchmark results from past seasons. But fundamentally we are trying to evaluate teams statistically that have not yet produced any statistics.

So today, two days before the season kicks off, I'm going to do my best impression of a voodoo witch doctor. The model is pretty simple. I start with a strong power ranking from the 2011 season. I adjust that number for lost production in each position group, the per play production of replacement players, and the general strength of the program (the capacity to reload). [Note that I am only using 2011 FBS teams. Even voodoo witch doctors have their limits.]

The first column is the 2012 predicted power ranking. Alabama comes out on top, and not by a little. In fact, Alabama is so far ahead of everyone else I considered manually adjusting them down a smidgen just to keep things interesting. LSU drops from a clear #2 in 2011 to 4th.

Good chance these guys get together again this year
The third column is the margin of victory for the 2012 team if they played the 2011 version (with a slight bias for the 2011 squad). No team is expected to take a bigger step back in 2012 than Boise St; fortunately for the Broncos, Michigan St. is also predicted to take a tumble. Looking at the clumping from #41-43, Houston, Michigan St. and Baylor should form a PQSD (post-quarterback stress disorder) support group; and the Redskins need to go get Keenum from the Texans. USC and Oklahoma jump up past LSU, and Michigan, Georgia, Texas, and Kansas St. also make big moves into the top 10.

The 4th column is the expected wins followed by the expected win distribution (or the probability that the team will win x games). While no team has a better than 3 in 10 chance of an undefeated season, USC, Alabama, Wisconsin, Florida St., and Georgia are all better than 3 in 20.

New Mexico has an 18% chance of going winless while the rest of the country has a 54% chance of producing another winless team.

Back of the envelope calculation: we have a 3-4% chance of an undefeated 'Bama and USC matching off for a national championship.

A Quick Guide to CFBTN Weeks 1 and 2

First, I should highlight that the models used on this website are more powerful as more data becomes available/more games are played. To state the obvious, not a lot of games have been played at this point.

No individual stats or projections are updated to 2012 (Individual: Stats, Fantasy, Heisman; Team Summaries). Where individual stats are listed these are from 2011.

No teams stats are updated to 2012 (Rank 2, Team Summaries, Maps). Where team stats are listed these are from 2011.

Team ratings are updated to 2012 (Team Summaries, Rank, Pick All). The major exception is the BPR (and VisualBPR), which ranks teams by wins and losses.

Predicted results are available for the 2012 season (Team Summaries, Summary, Picks, Champs*). I have not yet reformatted Standings.

Conference ratings and statistics (Conf: Rank, Versus) are not updated.

Tuesday, August 28, 2012

Future Feature: Expected Points Added

I have been working with Brent Blackwell over the last couple of weeks to develop a new individual performance metric, the Expected Points Added. While still in the developmental stage, early results are promising that the EPA will allow us to measure the contribution of a player not in carries, completions, yards, first downs, or turnovers but in points (that pesky little number that ultimately determines success or failure in football).

We start by assigning a point value to each situation on the football field by the average number of points teams score in those situations: 1st and 10 at the 50 is worth 2.89 and 2nd and 3 at the opp 43 is worth 3.22. We can then assign a point value to a play based on the expected points before and after a play - 7 yards on 1st and 10 at the 50 is worth .33 = 3.22 - 2.89. 

We can then attach that value to players based on their participation in the play. If we add up the EPA for the entire team over the course of a game, we get that team's score minus the expected value of each possession at the beginning of the drive. Related to the EPA is the NEPA (net expected points added) which also accounts for the impact of the play on the expected the opponent will score on their next possession. 


Monday, August 27, 2012

10+ Boring Predictions for 2012

Among my 10+ boring predictions for 2011 I divined that Andrew Luck would win the Heisman, the BCS title game would feature two relative newcomers, and Bo Pelini's head would literally explode. With that endorsement:

1) Alabama will beat Georgia to win the SEC. Unclear on their conference memberships, the WAC and Big East will also name Alabama their conference champion. The WAC and Big East will then merge to form the Big Athletic Conference. This will only compound the conference membership problem. By the end of the decade, Conference USA will be the only truly regional conference in America.

2) Teams in the Sun Belt and MAC will play games against each other. Their mothers will be able to verify this. Ohio will win a lot of games. We will pretend to care so we can present ourselves as truly erudite college football fans.

"Coach, it's not me, it's you. You're terrible"
3) Washington St will be better than Texas Tech (and Maryland). West Virginia (and Michigan) will be better than Arizona (and Oklahoma St), and I will find out why we aren’t all making fun of Coach Holgorsen’s hair. Ohio St will be better than Florida. USC will be better than the Seattle Seahawks. Alabama will be better than LSU (and Michigan, but not better than the Falcons). Texas A&M this season will be much better than in 2011, but not better than the Dolphins. Wisconsin will win 12 games with a quarterback discarded by a 2-10 team. Connecticut and Maryland will both be terrible (much worse than, say, Vanderbilt). And someone at the worldwide leader will wonder aloud why some struggling program hasn’t snatched up Rick Neuheisel yet. This means something. This is important.

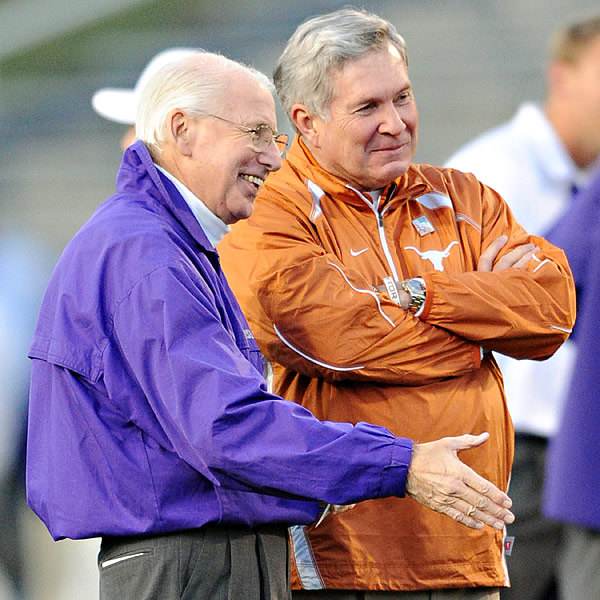
"Mack, did you try to negotiate an extension?"
4) Texas will again lose four or more games* despite giving up fewer than 17 points per game. Oklahoma will be the class of the Big XII but will lose to Kansas to fall out of national title contention. Kansas St will lose 6 games by 10 total points after Bill Snyder’s deal with the devil expires. Tuberville will plead with Snyder for the devil’s digits only to learn that Tech has a long standing arrangement that involves locking players in equipment sheds. [*I keep predicting this and it keeps coming true.]

5) Wisconsin will win their conference championship. Three Badgers will rush for over 1,000 yards and Danny O’Brien will set himself up as a Heisman contender in 2013. I am still boycotting the divisions established by that particular conference and, therefore, refuse to comment on who Wisconsin will beat in the championship game. But I will say that it will not be Penn St. In the confusion of conference realignment we will mistake Indiana, Purdue and Northwestern for B1G teams, but after watching them play at home we will remember they belong in the MAC.

6) Kenjon Barner will rush for 1,500 yards, but Matt Barkley will throw for 15,000 and win the Heisman. USC will beat Washington (and be better than Tennessee . . . that doesn't mean anything) to win the Pac-5,6,8,10,12. We will find out that Stanford was more than Andrew Luck; it was Jim Harbaugh and the fading remnants of his pixie dust. And even Harbaugh in the flesh wasn’t enough to beat Oregon.

"I will love you, Coach Edsall"
7) Florida St will NOT win the ACC. I don’t know who will win the ACC, and I don’t really care, but it WON’T be Florida St. Florida St will be 9-4. Next season we will all be amazed at the talent they have along the defensive line and we will put them in the top 10. In 2013, Florida St will not win the ACC. Nor will Maryland. Instead of firing Edsall, Maryland will punish Edsall by dropping its football program and reassigning Edsall to coach the new mens synchronized swimming team. Maryland fans will want to know if this will help them beat Duke in basketball. It will not.

8) Boise St will remind us that, even after losing 7 players to the draft, the better program beats Georgia by 14, not in triple overtime. Like Alabama, Boise St will claim 3 conference championships, but will do it by playing in three different conferences over the course of the season. The other teams in its conferences will also play games, and some of those games will be very entertaining, I’m sure.

Don't worry kids, this one doesn't count
9) It will slowly dawn on the football community that we ignored one of the best pre-bowl seasons in college football history, a head-to-head match-up and conference standings so we could crown a champion based on one game played a month after the season had ended, and that we responded to this by changing the rules to put more emphasis on these pseudo, post-season games. We will recognize that we have been duped by the major sports media into believing that this is what we want . We will then pay for their insider access and log on to their forums so we can read about and discuss the sad state of college football.

With no Sam Cunningham on the USC roster, Bama wins 24-17
10) Alabama will beat USC by 7 in the national championship game, and somehow we will twist this into meaning that the 7 terrible teams in the SEC are not terrible, that games ending 3-2 mean that your conference is good at football, and that a non-SEC team that tried to play a season in the SEC and had to play many of these 7 terrible teams would be murdered in the process because an SEC schedule is so brutal. We would think this even though last year the SEC East champ got a beatdown by the second best team in the MWC, and all statistical evidence shows that the SEC is only marginally better than the other elite conferences, and that the other elite conferences are, in fact, deeper. And I will rejoice in this now that my team is in the SEC.

Friday, August 24, 2012

Costliest plays of the last 5 years

By assigning point values to field position, down, distance and time, we can estimate the real point impact of a play. Expected point values increase as team's get closer to the end zone and decrease as the end of the half approaches and as they use up downs. By this measure, the most expected points come from the opponent's 1 yard line, first down, in the first 29 minutes of the half.

I also adjust for the expected points for the opposing team in their next possession. Teams that are pinned deep in their own territory tend to give up more points on the subsequent possession than teams that are forced to punt around midfield. 

With that in mind, the most possible points a single play could cost a team is 14 - if the team with the ball was expected to score 7 in their possession and allow 0 in the next possession, but instead gives up a touchdown on a turnover. Practically speaking the most points a team can lose on one play is closer to 12 because no team is ever expected to score 7 and never expected to allow 0.

So, the worst possible play is a turnover at the 1 yard line with about 1 minute left that is returned for a touchdown. That is, more or less, what happened to Army in their 2010 game against Navy. Trent Steelman lost the ball on the 2 yard line and then watched Wyatt Middleton return it 98 yards for a touchdown. That was the worst play in FBS football over the past 5 years and we can only assume it was one of the worst plays in college football history. 

The star of this list is UTEP's Quintin Demps, who returned two interceptions 100 yards for touchdowns. 


Thursday, August 23, 2012

Finding home field advantage: kickoffs

Teams kickoff just over 5 times per game on average, once to start the game and 4 more after scores. No other play in football is more dynamic in terms of the average speed of players on the field, the force of collisions, and the range of likely outcomes (i.e., the standard deviation of play point impact).

With that in mind, kickoffs seem like a leading candidate for finding home field advantage. Good kick coverage and returns require a level of insanity brought on by emotion and adrenaline, and no other play consistently gets fans on their feet and loud in the first quarter.

Turning to the numbers, home teams are .728 yards closer to the opponent's end zone after kickoffs on average (70.727 to 71.4555). With an average of just over 5 kickoffs per team per game that works out to about 3.74 yards per game. Road teams are slightly more likely to turn the ball over on kickoffs and less likely to take a kick back for a touchdown.

All together, home teams are .0327 points better per kickoff on average and .175 points better per game. Adding that to the advantage in penalties (.16) and field goals (.12), we have accounted for .455 of the 3.15 point advantage of home teams.

Wednesday, August 22, 2012

Penalty Profiles

Nothing really complicated here. I've been playing with penalty data recently so I decided to put together penalty profiles. I've grouped penalties into 8 groups and calculated the number of penalties per play.

Tulsa stands out. The Golden Hurricane are in the top 5 in avoiding logistic, procedure, holding and player contact penalties. Tulsa looks worse when looking at penalty yards per game (16th nationally in 2011) because they run more plays than the average team. 

There isn't a lot of correlation across penalty types - teams that are frequently penalized in one area are not much more likely to be penalized in another area. For example, Auburn was best nationally with one pass intereference call every 2000 plays, but was worst nationally in logistics, getting more than twice as many in this area than the average team.

Logistic - Not getting the right people in the right place on time; delay of game, illegal substitution, etc. 
Procedure - Moving early or in the wrong direction before the play; false start, illegal shift, etc. 
Contact Player - Illegal contact with an opposing player; face mask, clipping, roughing the kicker, etc. 
Contact Ball - Illegal use of the ball; illegal kicking, intentional grounding, illegal forward pass, etc. 
Offsides, Holding and Pass Interference (+ defensive holding) are listed separately


Tuesday, August 21, 2012

Quick note: What is the coin toss worth?

"blah blah blah and they'll get the ball to start the second half" = .9296317 points

I actually stumbled on this number on accident. I was calculating the value of an onside kick - is the risk worth the reward? - when I came across a snag I may never overcome (more on that another day). But in the mean time I had to calculate the the value of receiving a kickoff. 

On average, the kicking team outscores the receiving team by .0449188 over the next two possessions. Teams should (almost) always choose to kick to start each half except the receiving team has a 50% chance of getting an extra possession in that half. Because the average possession is worth 1.949101 points, the value of receiving the kick to begin the half is 1.949101*.5-.0449188=.9296317. So, the next time you're watching a game with friends, and your team will be getting the ball to start the second half you can say, "blah blah blah and they'll get the ball to start the second half, and that's worth .9296317 points on average."

Monday, August 20, 2012

The Bad Coaching Index, Penalties

It is an old adage in football that well-coached teams avoid the unnecessary mistakes. Among the most obvious of those potential mistakes are penalties. But not all penalties are created equal. I focus here on what I call non-competitive penalties. These are penalties that either 1) do not occur during the play or 2) do not offer the offending team a competitive advantage/do not advance the play. Because the penalized team would (almost) always be better off avoiding these penalties, a well-coached team should commit few of them. 

The Bad Coaching Index (BCI) measures how poorly coached a team is by how often they commit these non-competitive penalties-the lower the score, the better coached the team is. Among the penalties used to create this index are false start/illegal procedure/illegal shift, delay of game, unsportsmanlike conduct, illegal participation/substitution/formation, sideline interference and ineligible receiver downfield. 

That New Mexico, Western Kentucky and Florida Atlantic find themselves at the bottom of the list for 2011 should surprise no one. That Grobe has Wake Forest near the top is, again, to be expected. The biggest surprise to me is Army at #48.


Friday, August 17, 2012

16 Stats that Matter

"Happy families are all alike; every unhappy family is unhappy in its own way."
- Leo Tolstoy, Anna Karenina
How are all happy (that is, good) football teams alike? What do they have in common? They say defense wins championships, but that's absurd. Scoring more points than you let the other team score wins championships. Unlike families, football teams find many ways of doing that.

The 16 Stats that Matter offer a broad profile of college football teams. These sixteen numbers explain about 94% of the team's average margin of victory; in other words, they can tell us why a team, and its fan base, are happy.

These 16 stats focus on indicators of football fundmentals- red zone efficiency, turnovers, penalties, 3rd down conversions, etc. (I have a glossary at the end of this post.) I present them in a 16 Stats that Matter Team Profile Card which lists the 16 stats, the team's performance (and national rank) in that area (x), the national average (mu, looks like a u), the standard deviation* (z), and the point impact per game. At the bottom is the average margin that is left unexplained - A&M was somewhat exceptional last year in that the Aggies scored 6.4 points more per game (or allowed 6.4 fewer points per game) than the indicators would predict.

Looking at A&M's profile card, we see that the Aggies were very good at keeping other teams out of their backfield but very good at getting into other teams' backfields. On the other hand, they were less impressive at red zone defense, on first downs, and couldn't force a turnover to save their lives.

With the coaching change, we can expect Texas A&M's profile this year to look more like Houston's profile a season ago. If A&M averages 8.4 yards on 1st down they will be your 2012 national champions.
___________________
The Sixteen Stats
The "o" before the name of a statistic means "opponent", so, for example, opponent starting field position, opponent purple zone efficiency, etc. 

FieldPos, oFieldPos - Average starting field position, distance to the endzone. 

Negative, oNegative - Percent negative plays. This is the percent of plays the teams runs that end in the ball handler being tackled behind the line of scrimmage. 

Explosive, oExplosive - Explosive plays per 100 possessions. Explosive plays are run or pass plays that go for more than 25 yards, punt returns that are 25 yards or more and kick returns that exceed 45 yards. 

RedZone, oRedZone - Red Zone efficiency (points per possession). 

3rdDown, o3rdDown - Third down conversion rate minus expected conversion rate.

1stDown, o1stDown - Average yards on first down

Penalty - Penalty yards per 100 plays

Turnover, oTurnover - Turnover margin per 100 plays

FieldGoal - Field Goal POE (points over expected)

* The standard deviation is a standardized way of comparing a team's performance across indicators. For example, Texas A&M has a standard deviation of 1.46 for negative plays and .81 for 3rd down conversions. This means that while Texas A&M is better than average in both cases, it is more exceptional at making negative plays.

Thursday, August 16, 2012

Finding home field advantage: penalties

Yesterday I showed that home teams in conference games are 3.15 points better. I took it as my challenge to explain exactly when and where that advantage comes from.

I started with field goals. Home teams are slightly more accurate, a difference that amounts to .12 points per game. The advantage is larger in pressure situations, so that home/road field goal accuracy has very little effect in blowouts and early in games and a larger (but still not overwhelming) effect late in close games.


Today I look at penalties. On average, home teams are penalized 2.22 fewer yards per game than road teams which, when we account for when and where those penalties occur, are worth about .16 points per game. Breaking it down by penalties on the offense and defense (and adjusting for the number of plays run by the offense and the defense), 75% of the home field advantage in penalties comes on defense (more on that later).

Next, we look at specific situations: high leverage plays are those late in games in which the outcome is still undetermined and the purple zone is the last 10 yards before the end zone. The penalty advantage for home teams is much larger in high leverage situations; about 8 yards (.5 points) if an entire game were high leverage. Surprisingly, the same is not true of purple zone situations. Home teams are penalized more inside the 10 yard line.


Finally, I break it down by call. Consistent with my expectations, road teams are much more likely to get false start and delay of game penalties against them. This difference is worth about 1.4 yards per game. (In case you're wondering, that gap is not larger in high leverage or purple zone situations.) Holding calls, on the other hand, are more likely to go against the home team. Extra pass interference calls against the road team are worth 1.1 yards per game and offsides calls add .16 penalty yards to the road team tally.


Roughing the passer (.22 yards/game), face mask (.13), and kick catching interference (.12) calls are also substantially more likely to go against the road team. Unsportsmanlike conduct (.52) and illegal block (.22) are more likely to go against the home team. I'm open to any good theories about why that might be the case.

Adding home field advantage in penalties to field goal accuracy, we have not accounted for .28 points of the 3.15 points of home field advantage. With more than 90% remaining, I will turn next to turnovers.

Wednesday, August 15, 2012

Finding home field advantage: field goals

Can a home crowd rattle a visiting kicker?

To me, home field advantage is a fascinating topic. I assume that's because I grew up attending games in the best home environment in college football. On average, home teams get a 3 to 3.5 point boost from playing in their own stadium. Some teams get moreI've argued before that this is more a product of (1) the travel required to get to these stadiums and (2) the hostility of the crowd (in that order) than the number of people in attendance. Getting to Lubbock, Boise, Lincoln or College Station takes something out of a team. Appalachian State found last year that it's harder to go into Lane Stadium than the Big House.

But how does home field advantage actually play out? Are home teams better in every way, or do they enjoy advantages in specific aspects of the game? If the crowd motivates the home team, we would expect better play in pressure situations and in extending momentum. If the crowd disrupts the road team, we would expect more false starts, turnovers and other miscues, or the road team might be more conservative in their play calling to avoid mistakes. If travel leads to fatigue we would anticipate better play from the home team late in games and more explosive plays. Where, exactly, do those extra 3 points come from?

My challenge is to find a definitive answer using the available statistics. I begin with this: over the last three seasons, home teams in conference games have scored 28.576 points per game while road teams have scored 25.425 for an average margin of victory of 3.151. By looking only at conference games, I can rule out any correlation between playing at home and any other quality that might influence play because, in the appropriate technical parlance, location is randomly assigned*. So, I need to explain where those 3.151 points come from. Fortunately for me, I have a bag full of tricks for assigning point value to events in football games.

I begin today with field goals. First, are home teams more likely to make field goals? Second, is that advantage larger in pressure situations? 

In answer to the first question, in 1,350 conference games (at non-neutral locations), home teams have attempted 2,107 field goals, connecting on 74.1%, and road teams attempted 2,021, hitting 71.4%. Removing the advantage that allowed home teams to kick more field goals (something I'll look at another day), that gap in accuracy is worth .121 points per game or about 3.84% of the home field advantage. Using the KPOE method I discussed earlier, home teams enjoy a .122 point advantage per game from greater field goal accuracy.

What about pressure situations? I looked only at kicks in the 4th quarter in which the field goal could put the kicking team within a touchdown, give the kicking team a lead greater than a touchdown, or anything in between. In these situations, the home team enjoyed a .261 point advantage per kick, more than three times larger than the .082 point advantage per kick for home teams for all field goals. (Both home and road kickers are substantially worse in pressure situations.)

Net net, home teams have a clear advantage when kicking field goals. That advantage increases with leverage (leverage being the degree of influence that kick has on the final outcome of the game). While the former could possibly reflect a familiarity with the field and field conditions, the latter is undoubtedly a result of the crowd rattling (or failing to comfort) the road kicker when the heat was on. So yelling at the opposing team's kicker does help, but, at .121 points per game, rarely affects the outcome; kicks can sail wide right in Tallahassee just as they can in Miami.


______________________________
*In non-conference games, teams from bigger programs are more likely to host teams from smaller programs. Usually, teams from bigger programs are better - though Georgia discovered last season that this is not always true. This makes it hard or impossible to scientifically analyze home field advantage in non-conference games.

Monday, August 13, 2012

Is red zone efficiency really a myth?

Is football outside the 20s different than football between the 20s?

The belief that red zone efficiency is a meaningful statistic centers on this proposition. Aaron Schatz of Football Outsiders argues that red zone efficiency is a myth because it cannot be used to predict future red zone efficiency any better than other offensive statistics--in other words, good offenses move the ball, in the red zone, at midfield, all the same.

But that's for the NFL. A leading argument in favor of red zone efficiency is that certain styles of play are more effective on a smaller field. College football teams are more diverse than NFL teams. (In the technical parlance, we would say that we fail to find a significant relationship with the dependent variable because their is insufficient variance in the independent variable.)

I divide college football teams over the last 5 seasons (a total of about 600 teams) into four categories: Grinders, Paulies, Leachers, and Bikers. Grinders are teams that depend on short yardage run plays: Army has been the poster child of grinding for the last 4 years. Paulies are teams that depend on explosive run plays, named for Georgia Tech's Paul Johnson. Leachers use high percentage, short yardage passes: East Carolina, headed by Mike Leach progeny, is the leading example recently. Finally, the Bikers, named for Bobby Petrino, air it out; Arkansas, Tulsa and Houston have been the most prominent Bikers for the last several years.

The logic of red zone efficiency says that Bikers, especially, would do poorly in red zone situations because the offense depends on stretching the field vertically. Grinders run a goal line offense from one endzone to the other, so they should be unaffected by red zone situations. Leachers and Paulies stretch the field horizontally as much as vertically, and the field is just as wide inside the 20 as at midfield. They should find it harder to move the ball, but should do relatively well compared to Bikers.

And now for statistics. (The analysis is based on 1 million plays since 2007.) All styles struggle in the red zone. Yards per play begin to fall at around the 40 yard line and then plummet inside the 20. There are two leading reasons for this: 1) you can't snap off a 50 yard run when you're 30 yards from the back of the endzone and 2) defenses don't have to worry about you snapping off a 50 yard run when you're 30 yards from the back of the endzone. In the middle of the field, Bikers and Paulies average more yards per play, precisely because they are better at explosive plays.

Yards per play by distance to goal line
Looking closer at the last 40 yards, this next chart compares the performance of the 4 styles relative to the other styles. So, for example, Grinders get about 93% as many yards per play as other teams at the 40 yard line, but 5% more yards when they are inside the 3. Particularly inside the 10, Grinders are better than others and Bikers are worse even when the opposite is true over the other 90 yards.(Technical note: the trend lines for Grinders and Bikers are statistically significant. The relationship between style and yards per play inside the 10 and outside the 10 are also significant.)

Yards per play versus league average
Now that is all fine and dandy, but what really matters is if these teams are scoring points. I started by calculating the average points per possession by field position for each style. I then subtracted the league average from that. So, for example, when inside the 3, Paulies score 1/10 of a point more on average than the typical team. Again, Bikers do poorly inside the 10, especially considering their performance everywhere else. Grinders and Leachers are about league average when they get close to the goal line. My interpretation of this is that Grinders are more likely to make forward progress in the red zone, but less likely to get the play they need to plunge over the goal line than Paulies.


Net net, in college football it does seem that there is a relationship between style of play and red zone efficiency.  And this relationship is the opposite of what we find over the rest of the field. High octane passing offenses especially struggle, with the performance dropping inside the 25 and falling below league average around the 10. Teams with explosive running games--Oregon, Georgia Tech, Nevada, West Virginia under Rich Rod, Michigan, Wisconsin, and Virginia Tech to name a few--offer the best combination of high yards per play across the middle of the field and high points per position in the red zone.

Friday, August 10, 2012

What is the kicking game worth?


The last few posts discussed the point contribution of special teams - kickoffs, punts, and field goals. By adding those values together we get the kicking game points over expected (KGPOE). 

By this measure, Florida State comes out on top. The Seminoles were solid in all three areas and excelled on generating field position on punts. At the other end, Louisiana-Monroe struggled in all three areas. If Louisiana-Monroe could have traded their kicking game for Florida State's, it would have contributed about 10 points of margin per game. Another notable finish is Virginia Tech; despite Beamer Ball, Virginia Tech finished 2011 at an unspectacular 44th.

In the second and third columns I've ranked each by their point differential (second column) and their point differential if they exchanged their kicking game for the league average. Texas A&M, for example, finished 23rd nationally in point differential, but would have been 34th without the stellar play of Randy Bullock.

Point Diff. Rank Components
Team KGPOE W/ KG W/O KG KO PUNT FG
1 Florida St. 62.4 14 22 30.5 23.2 8.6
2 Oklahoma St. 59.2 7 9 43.7 9.0 6.4
3 LSU 52.3 4 4 23.5 22.2 6.5
4 Boise St. 45.6 5 5 42.8 6.9 -4.1
5 Auburn 44.5 82 94 26.3 14.5 3.6
6 Rice 42.9 102 109 11.0 19.5 12.3
7 Western Mich. 42.8 36 54 34.9 4.0 3.9
8 Arkansas 41.7 15 19 32.4 5.9 3.4
9 Cincinnati 41.7 17 25 25.4 17.1 -0.8
10 Texas A&M 39.5 23 34 21.8 -1.8 19.6
11 Southern Miss. 38.7 11 12 20.7 14.4 3.6
12 Utah 38.1 49 64 19.4 16.4 2.2
13 Kentucky 37.4 97 106 15.5 17.6 4.3
14 Temple 37.0 12 13 30.4 6.8 -0.2
15 Oklahoma 36.2 10 10 11.4 14.2 10.5
16 Nebraska 35.5 42 57 18.5 6.9 10.1
17 Miami (FL) 32.1 40 51 23.6 4.3 4.2
18 Oregon 29.6 6 7 16.7 14.1 -1.2
19 Louisiana Tech 28.6 35 43 6.8 23.4 -1.6
20 Mississippi 26.9 111 115 9.4 14.7 2.8
21 Florida 26.3 47 56 8.3 4.0 13.9
22 TCU 24.3 9 8 19.7 0.3 4.3
23 Oregon St. 23.3 98 103 16.2 9.7 -2.5
24 Vanderbilt 21.9 48 53 17.9 10.8 -6.7
25 Clemson 21.4 51 59 12.3 -0.1 9.2
26 Mississippi St. 20.5 45 47 15.3 10.1 -5.0
27 Michigan 19.5 13 11 26.6 -9.3 2.3
28 Ohio St. 19.2 57 63 1.4 8.8 8.9
29 USC 17.2 21 24 2.5 6.8 7.9
30 Connecticut 17.0 69 77 -1.9 5.4 13.5
31 BYU 16.7 26 32 15.2 4.8 -3.3
32 Tulsa 15.5 42 44 16.0 -6.9 6.4
33 Purdue 15.4 68 74 2.9 7.0 5.4
34 UTEP 15.3 83 85 4.5 15.7 -4.9
35 Texas Tech 14.5 87 93 -3.3 9.7 8.1
36 Washington 14.4 79 82 -0.6 10.1 4.9
37 Georgia 13.7 18 20 17.0 1.3 -4.6
38 Ohio 12.2 28 33 1.4 6.1 4.7
39 Arizona St. 11.9 52 50 5.1 7.9 -1.1
40 Michigan St. 11.3 16 17 6.7 0.3 4.2
41 Wisconsin 11.0 2 3 -2.2 9.6 3.6
42 Iowa 10.8 55 60 -0.8 11.0 0.7
43 Ball St. 10.6 99 101 -1.4 11.4 0.6
44 Virginia Tech 10.4 22 23 19.9 -8.9 -0.7
45 UCLA 10.0 100 102 -0.8 12.9 -2.1
46 California 9.8 53 52 -8.3 8.0 10.2
47 Arkansas St. 9.7 19 21 4.6 2.7 2.4
48 Boston College 9.4 86 90 6.3 6.2 -3.1
49 Houston 8.8 1 1 12.6 -3.5 -0.2
50 Eastern Mich. 8.8 80 81 9.8 1.3 -2.3
51 Iowa St. 8.8 93 95 7.5 4.1 -2.8
52 Pittsburgh 8.8 65 68 3.3 3.1 2.4
53 North Texas 7.4 88 92 -6.2 19.2 -5.6
54 Kansas St. 7.3 54 55 8.9 -3.8 2.2
55 Bowling Green 6.6 78 79 -9.5 18.9 -2.8
56 Missouri 6.4 27 27 6.4 6.9 -6.9
57 San Diego St. 5.9 49 46 14.8 4.8 -13.7
58 UCF 5.9 32 35 14.4 -5.9 -2.6
59 Utah St. 5.7 44 41 -2.4 13.5 -5.4
60 San Jose St. 5.2 88 91 6.1 4.0 -4.9
61 Texas 4.3 41 39 7.1 -9.8 6.9
62 Idaho 4.2 106 108 -18.2 20.8 1.7
63 Colorado St. 3.1 101 100 -0.6 9.1 -5.4
64 Louisville 2.5 64 66 -3.5 6.0 0.0
65 Stanford 1.7 8 6 0.9 2.4 -1.7
66 Duke 0.1 96 97 11.5 4.7 -16.0
67 SMU -0.2 60 61 11.7 -7.0 -4.9
68 Troy -0.7 105 104 7.6 -1.4 -6.9
69 Penn St. -0.7 61 62 1.4 -1.1 -1.0
70 Notre Dame -1.5 30 28 5.5 -3.8 -3.2
71 Wake Forest -2.3 72 76 2.1 -6.2 1.8
72 Army -2.4 81 80 6.7 -3.4 -5.6
73 Air Force -2.6 37 36 -8.1 -1.4 6.8
74 Minnesota -3.0 107 107 3.8 -14.6 7.8
75 South Florida -5.1 39 38 -2.0 -5.8 2.6
76 Rutgers -5.4 32 31 -8.1 6.0 -3.3
77 Northwestern -5.6 66 65 -1.6 -1.8 -2.3
78 Virginia -6.1 70 70 5.5 -9.3 -2.3
79 Baylor -7.4 32 29 4.7 -6.7 -5.4
80 Wyoming -7.4 74 75 -9.8 5.2 -2.8
81 Arizona -7.5 85 83 -0.6 -0.1 -6.8
82 Hawaii -8.1 63 58 -15.4 9.6 -2.4
83 Navy -8.5 67 67 -4.4 -2.5 -1.7
84 Colorado -9.7 114 113 -11.6 1.9 0.1
85 Illinois -11.3 59 48 -9.3 -5.8 3.8
86 Georgia Tech -11.4 31 26 -5.2 -1.9 -4.2
87 Central Mich. -12.2 103 99 -2.8 -11.1 1.7
88 FIU -12.3 46 37 -13.4 -7.9 9.1
89 Tennessee -12.8 77 73 2.3 -14.2 -1.0
90 Alabama -14.5 3 2 -9.2 -0.2 -5.1
91 East Carolina -15.2 90 84 3.6 -23.4 4.7
92 South Carolina -15.9 19 16 -6.5 -10.1 0.7
93 La.-Lafayette -16.1 62 49 -38.2 10.7 11.4
94 Indiana -17.3 110 110 -14.0 -9.1 5.8
95 Memphis -17.6 115 114 -1.0 -12.0 -4.6
96 Buffalo -18.8 93 89 -9.5 -8.3 -1.0
97 Washington St. -20.1 75 72 -21.3 -3.5 4.7
98 Western Ky. -20.5 75 71 -7.3 11.8 -25.0
99 Miami (OH) -20.6 73 69 0.8 -13.9 -7.5
100 North Carolina -20.9 58 42 -10.0 -8.9 -2.1
101 UNLV -21.4 118 119 -9.7 -11.8 0.1
102 Marshall -22.1 95 88 -19.9 -2.7 0.6
103 UAB -22.4 112 111 -32.7 1.5 8.9
104 Kent St. -23.8 91 87 -8.4 -20.2 4.7
105 Fresno St. -24.0 91 86 -18.3 -3.3 -2.4
106 Syracuse -24.9 84 78 -17.7 -6.9 -0.2
107 North Carolina St. -25.1 56 40 -19.0 -5.5 -0.7
108 Nevada -27.3 37 30 -16.1 -5.4 -5.7
109 West Virginia -29.0 24 14 -23.9 -2.8 -2.2
110 Kansas -29.6 116 116 -18.1 -4.4 -7.1
111 Florida Atlantic -30.0 117 117 -8.1 -18.3 -3.7
112 Tulane -31.2 113 112 -19.0 -10.2 -1.9
113 Middle Tenn. -31.4 109 105 -27.5 2.4 -6.3
114 Toledo -31.9 25 15 -25.7 -12.5 6.3
115 Maryland -32.2 104 96 -20.6 -0.2 -11.4
116 Northern Ill. -37.6 29 18 -31.8 -4.5 -1.3
117 Akron -42.0 119 118 -31.3 -14.1 3.4
118 New Mexico -43.9 120 120 -15.8 -21.5 -6.7
119 New Mexico St. -46.0 107 98 -20.1 -17.8 -8.0
120 La.-Monroe -66.6 71 45 -28.3 -26.0 -12.3