Look at last week's post for an explanation of the Incongruency Index
Wednesday, October 31, 2012
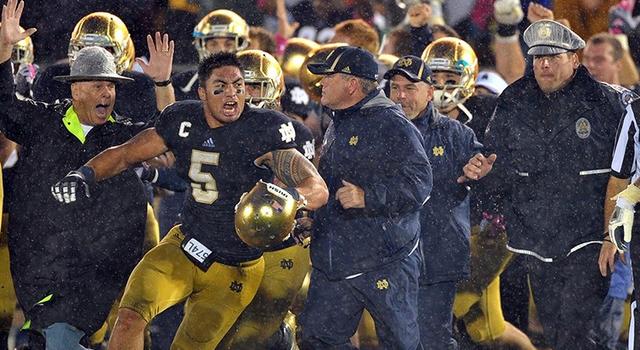
Explosive Plays: Johnny Football sets the pace
[I have resolved the mysterious disappearance of West Virginia. Thanks for the note!]
[Welp, this is embarrassing. In trying to figure out where West Virginia had disappeared to I found another hiccup in the computer code. Sorry.The problem is now resolved.]
The stat below is explosive plays per possession. An explosive play is any offensive play that goes for more than 25 yards or kickoff return for more than 45 yards.
By this metric the country's most explosive team is Texas A&M. Considering the Aggies have also played two of the three teams that are best at preventing explosive plays, this is remarkable . . . but still unsurprising: Sumlin-led Houston teams were always explosive and Johnny Football is a human highlight reel. Aggie fans have a lot to be excited about - winning in the SEC, smashing Arkansas, having the best player in college football (tied with Collin Klein) - but after Sherman called for a gazzilion quick outs last year with an NFL franchise quarterback and talented wide receivers, 42 explosive plays for every 100 possessions has to be near the top of the list.
Tuesday, October 30, 2012
Week 10 Fantasy Bumpers
A fantasy bumper is a player that should perform significantly better than average this week. There are generally two reasons for this: 1) an established player has a good matchup or 2) poor performance or injury to teammate will give the player more opportunities. In the first case, these players are already owned so you want to make sure they are in your lineup. In the second case, they could be a valuable pickup.
Since this is a stats-based site and not a fantasy site, and I maintain this site on top of my day job while trying to raise a son and keep my wife from realizing she could do a lot better, these results are based on the best, most recent stats available to me and nothing more. It falls on you to do your own research. For example, my generated list of injuries apparently missed that Caleb Rowe has become the 4th Maryland quarterback to fall to Edsallitis, and MJ McPeek did not get the start Saturday for CSU against Hawaii. Cody Green is questionable for the game against Arkansas, and Kalen Henderson's 8 for 23 against Rice isn't keeping him on the bench.
Polling CFBTN
The BPR ranks teams only on wins and losses, the power ranking is used to predict who would win if two teams played/played again, and the Hybrid ranking combines features of the two and is meant to reflect the logic used in human polling.
Notre Dame moves into the top spot in the BPR as it gets more credit for beating Oklahoma than Kansas State does for its win over Texas Tech (who got blasted by the Sooners). Alabama moves into third, but is still a good distance from the top two.
Alabama reigns supreme in the power and hybrid rankings, though. Oregon and Kansas State are neck and neck at #2 and #3 in the power rankings and Kansas State enjoys a small margin in the hybrid rankings. The next group in the power rankings includes Oklahoma, Notre Dame, Florida, Florida State and Texas A&M.
Monday, October 29, 2012
Week 9's best defensive performances
Notre Dame was able to hold Oklahoma to 15 yards rushing and force Landry Jones to beat them if Oklahoma was going to win. They did not win. The Sooners scored 13 points on 12 possessions. Notre Dame and Kansas State have the unique distinction of finishing in the top 10 on both offense and defense this week.
Florida has been less dynamic than Oklahoma offensively this season, but Georgia gave up only 9 points on 13 possessions to the Gators. While I'd like to give more credit to Georgia for a big win, this is a game that the other team lost more than Georgia won.

Week 9's best offensive performances
The week's most impressive offensive performance, and the most impressive offensive performance this season, came from Johnny Manziel and Sumlin's Aggies. Both Manziel and backup Showers scored touchdowns on every real possession for Texas A&M (3rd string Matt Joekel had less success in his one series). Auburn had been allowing 25 points/game; the Aggies scored 21 in each of the first two quarters. The Aggies were impressive on film as well as statistically, but we can't ignore Auburn's role in allowing A&M to march unimpeded down the field time and again.
Boise State and Navy also managed an EP3 greater than 4. Given that the maximum EP3 for a possession is a little over 5, and that is only possible if the possession begins deep in the team's own territory, an average over 4 for an entire game is absurd. There have only been five of these all season and we saw three this week.

Sunday, October 28, 2012
Turnovers goeth before the fall, four horsemen ride again, two others are headless
Because I live deep in the heart of ACC country I have been force-fed Duke, Virginia and the crew for the last six years. It isn't sticking. I like watching football in general, but I am no more drawn to ACC football than I am Sun Belt or MAC football. And sometimes I'm just not sure they play by the same rules when Ron Cherry and his ilk are calling the games. ACC football is a very odd brand of football.
Saturday, October 27, 2012

Friday, October 26, 2012
Week 9: An EPA Preview
Breaking Bad in the Big 10, why the CFB universe revolves around South Bend, and giving the aspiring Davids their due
How bad is the Big 10? The short answer: less bad than you probably think. The Big 10 is at the bottom of the big four (with the Pac-12, SEC and Big 12) but still ahead of the rest. According to the conference power rankings, the SEC and Big 12 are head and shoulders above the rest, then the Pac-12, Big 10, Big East and ACC are in the next pack with the Pac-12 and Big 10 holding a small lead on the other two. And there is a rumor going around that the best of the Big East are better than the best of the Big 10. Not true. The Big East is actually 6th by P-Top, a statistic that specifically evaluates the top of the conference. In the team power rankings, four Big 10 teams are ahead of Rutgers, the Big East's highest rated team. The reason we are down on the Big 10 has more to do with what the Big 10 is doing right than what they are doing wrong: the Big 10 has the third toughest non-conference schedule (behind C-USA and the Sun Belt).
This means that Michigan and Nebraska are probably better than you think they are. This week we get a little more insight into which of the two is better. If Michigan wins they will all but lock up the divisional title. If Nebraska wins they will still need to win out (which would include beating Penn State and Michigan State) or they will need Michigan to lose again (presumably to Ohio State). Both teams are in the bottom 25 nationally in turnovers per possession, so this game could hinge on a big fumble (for Nebraska - 121st in fumbles per play) or interception (for Michigan - 124th in INTs per pass), or a few of each.
This means that Michigan and Nebraska are probably better than you think they are. This week we get a little more insight into which of the two is better. If Michigan wins they will all but lock up the divisional title. If Nebraska wins they will still need to win out (which would include beating Penn State and Michigan State) or they will need Michigan to lose again (presumably to Ohio State). Both teams are in the bottom 25 nationally in turnovers per possession, so this game could hinge on a big fumble (for Nebraska - 121st in fumbles per play) or interception (for Michigan - 124th in INTs per pass), or a few of each.
Thursday, October 25, 2012
Running back EPAs: Mid-Major Monsters
by Brent Blackwell
As expected, #1 is Dri Archer of Kent St. Wait, that’s not what you expected? Archer leads the country in yards per attempt, over 10, and Darrell Hazell has helped him out by not using him heavily in run-out-the-clock situations for the 6-1 Flashes. Archer’s no fluke, with a reported 4.3 40 time. He’s been worth a point every two times he’s touched the ball this year.
Archer’s ascent was made possible by Cody Getz’ ankle, which held him out against New Mexico. Louisiana Tech’s Kenneth Dixon enters the top 5 thanks to his week 8 performance against Idaho, the top rushing performance of the year according to EPA (+19.69 points). Dixon’s 17 carries for 232 yards and 6 TD (yes, 6) are the standard by which other elite performances will be judged this year. Oregon’s 3rd string RB De’Anthony Thomas remains in the top 5 after a surprisingly poor performance against Arizona State. Also notable is Tulsa, which places two RBs in the top 30 - #5 Trey Watts (683 yards, 2 TD) and #26 Alex Singleton (496 yards, 15 TD).
On the more negative side of the rankings, I see two Rutgers runners: Jawan Jamison (990 yards, 5 TD) and Savon Huggins (127 yards, 1 TD). Jamison has been good at times, so without looking, I’d guess his meager value is a result of Rutgers over-committing to the run in order to protect leads. I’d apply the same hypothesis to Florida’s Mike Gillislee and Oregon State’s Storm Woods as well.
Quarterback EPAs: Return to Normalcy?
by Brent Blackwell
October proved to be a month of course-correction. Pre-season favorites dismissed from Heisman consideration have slowly climbed their way back towards the top, as we see Matt Barkley (10th), Denard Robinson (16th), and Tyler Wilson (29th) all in the top 30. Landry Jones seems back on track, and even Houston’s David Piland has found the black. After September, I wondered if that would be possible.
The Big XII dominates the standings again, this time with 4 of the top 6 ranked QBs. Texas Tech’s woefully underappreciated Seth Doege returns to the top of the board with +93.89 points. Just behind him is KSU’s Collin Klein with +90.03, though Klein is the NEPA leader at +102.32. With WVU’s Geno Smith and Baylor’s Nick Florence not far behind, it’s a good year for watching quarterbacks in the Big XII.
Other names near the top include NIU’s Jordan Lynch, who is doing as much with his legs (1049y / 13TD rushing) as his arm (1710y / 13:3 TD:INT ratio), Nevada’s Cody Fajardo (over 2300 combined yards and 20 TD despite missing a game), and national yardage leader Rakeem Cato of Marshall, who has attempted twelve passes in the time it took you to read this sentence.
The names near the bottom teach us a valuable lesson: QBs should never associate themselves with the Kansas Jayhawks. Current KU QB Dayne Crist has been 69 points worse than average this year. The only QB within a TD of being as bad? Colorado QB (and former Jayhawk) Jordan Webb. Also in the -60 club are SMU’s Garrett Gilbert, the worst June Jones-coached QB since Ryan Leaf, and Idaho’s Dominique Blackman, who leads the nation this season in both interceptions thrown (13) and head coach careers killed (1). Also, if you noticed, Gene Chizik shuffled some deck chairs. You might not have noticed, because all deck chairs pretty much look the same when running for their lives away from SEC defensive linemen.
Wednesday, October 24, 2012
Diagnosing statistical indigestion: the incongruency index
The goal of CFBTN is not to have the fanciest looking/sounding model for predicting outcomes, but the most robust. This means that the model draws on more than a hundred variables, evaluates teams in dozens of different ways, and then weights and combines those different evaluations using past results to make predictions. That makes it hard for me to explain exactly how the model works - it is, in fact, many different models that I slam into each other in hopes of making the Captain Planet of models. Not exactly an elegant process. It also means that some pieces might not agree with the rest, giving the model statistical indigestion.
Now we could look at these incongruencies as a problem, a source of error. Or we could see these incongruencies as information that gives us insight into a team's and a matchup's idiosyncrasies - a "what to watch for". I choose the latter.
Now we could look at these incongruencies as a problem, a source of error. Or we could see these incongruencies as information that gives us insight into a team's and a matchup's idiosyncrasies - a "what to watch for". I choose the latter.
Oregon, Florida and the tale of two halves
I've been told about 15 times this season that my assessment of Oregon is all wrong. Oregon, the story goes, gets a big lead early and is playing third stringers in the third quarter, so Oregon is much better than the final score suggests. I've been dealing with this on a case-by-case basis, but I think it's time I deal with the argument head on and for everyone to see.
I'm using the EP3+ here. The nice thing about the EP3+ is that it 1) adjusts for strength of schedule and 2) it adjusts for non-competitive situations. Also, because it is a drive-based metric, it is tempo independent; we often overrate offenses and underrate defenses because teams play faster, have more possessions and, therefore, tend to score more points, but that's not a problem for the EP3+. The unique thing here is that I divided the EP3+ by half, so if Oregon really is the bees knees early in games they should have a massive score for their first half EP3+.
I'm using the EP3+ here. The nice thing about the EP3+ is that it 1) adjusts for strength of schedule and 2) it adjusts for non-competitive situations. Also, because it is a drive-based metric, it is tempo independent; we often overrate offenses and underrate defenses because teams play faster, have more possessions and, therefore, tend to score more points, but that's not a problem for the EP3+. The unique thing here is that I divided the EP3+ by half, so if Oregon really is the bees knees early in games they should have a massive score for their first half EP3+.
Tuesday, October 23, 2012
Red Zone Efficiency
Red Zone efficiency isn't really a unique skill. Some offensive styles are more effective than others near the goal line, especially in the purple zone (10 yard line in). But on the whole, good offensive teams are good at their own 20, at midfield, and in the red zone. The same goes for red zone defense. (This doesn't mean I don't think teams shouldn't practice goal line offense and defense, but that the 1st derivative of the returns curve is large and negative - most of the benefit is captured early in practice, and additional practice would be better spent on the team's standard offense).
Week 9 Rankings
The BPR ranks teams only on wins and losses, the power ranking is used to predict who would win if two teams played/played again, and the Hybrid ranking combines features of the two and is meant to reflect the logic used in human polling.

Monday, October 22, 2012
Week 8's best defensive performances
In this weekly feature, we adjust a team's effective points per possession (EP3) by the strength of the opponent's defense to get a true measure of their offensive performance (and, inversely, the opponent's defensive performance). EP3 recognizes that field position has a real value and not just points on the scoreboard. EP3+O is the offense's opponent adjusted EP3 offense, or, in other words, it measures how good the opponent's offense is. Perf-D rates a team's defensive performance that week given their opponent's EP3 that week and the opponent's EP3+O.
We know Oregon can score points, so the Ducks landing at the top of the Perf-D should be an eye-opener for the rest of the nation. The only problem for Oregon is that Kansas State came in 7th in Perf-D and was te nation's best in Perf-O, and Florida finished #3 by both metrics.

We know Oregon can score points, so the Ducks landing at the top of the Perf-D should be an eye-opener for the rest of the nation. The only problem for Oregon is that Kansas State came in 7th in Perf-D and was te nation's best in Perf-O, and Florida finished #3 by both metrics.
Week 8's best offensive performances
In this weekly feature, we adjust a team's effective points per possession (EP3) by the strength of the opponent's defense to get a true measure of their offensive performance. EP3 recognizes that field position has a real value and not just points on the scoreboard. EP3+D is the opponent's opponent adjusted EP3 defense, or, in other words, it measures how good the opponent's defense is. Perf-O rates a team's offensive performance that week given their EP3 that week and the opponent's EP3+D.
The best offensive performance of the weekend came from Kansas St. Readers of this blog should not be surprised to see the Wildcats on top, unless they read this blog but still think I'm an idiot. According to the model, Kansas State easily has the nation's most effective offense. They score an absolutely absurd 3.75 points/possession. On Saturday they scored 5.5 points/possession, including seven straight touchdowns.
Florida, on the other hand, makes a surprise visit to the top of the list. If Florida can consistently stay in the top 10 in the Perf-O they will be the 2012 national champions. Of course, Alabama wasn't too far behind at #13. Despite racking up 43 points in the first 18 minutes, Oregon does not make the top 25 (they came in at #30), but they do have a prominent position in the Perf-D top 25. BYU also makes a rare visit to the top 25 by scoring 14 against Notre Dame.

Sunday, October 21, 2012
Why I hate lazy, narrative-based analysis, fun with the transitive property, and Browning goes the distance, again
West Virginia scores a ton of points and wins less than convincingly against Texas and Baylor. I tried to warn the world that Baylor could make any offense look proficient and that Texas couldn't tackle a toddler, but the world refused to listen. I yelled it from the mountaintops that Kansas State has scored more points per possession than West Virginia and actually has a much better offense, but my analysis fell on deaf ears. You decided West Virginia was the unstoppable force after one game, a game in which they gave up 63 points. You refused to see the light when Tech made Geno Smith look silly. The predominant opinion on Kansas State was shaped by the 2011 season and hasn't changed despite mounting evidence that the 2012 team is a different beast. This is what happens when people refuse to look at the data, look at the real evidence: they look stupid.
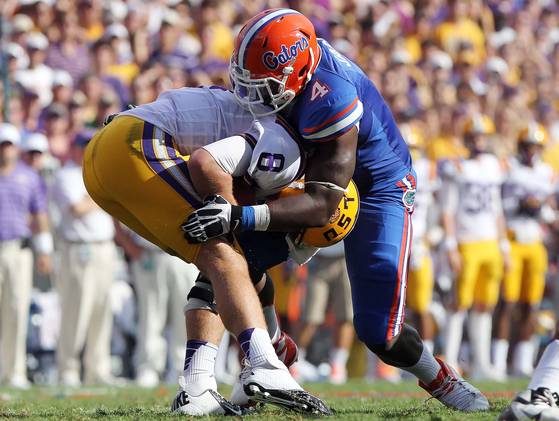
Speaking of stupid, anyone that looks at the LSU/A&M game as confirmation of their silly notions about the superior SEC style of play and the superiority of SEC athletes is hopelessly dense. A&M lost the game despite outgaining LSU because they turned it over five times, missed two field goals and an extra point. I don't know if any team has ever won a college football game with that resume. Then I hear that this game is a classic example of how LSU plays - getting short fields by forcing turnovers and big special team plays. That's just not true. LSU has needed more yards per point so far this season than Texas A&M. LSU is relatively weak at forcing turnovers, outside of the top 25 in turnovers per possession this season. But too many people are happy bathing in the preconceived notions and unsubstantiated claims to bother with facts. I am more convinced that Texas A&M is the superior team after the game than I was before.
Speaking of stupid, anyone that looks at the LSU/A&M game as confirmation of their silly notions about the superior SEC style of play and the superiority of SEC athletes is hopelessly dense. A&M lost the game despite outgaining LSU because they turned it over five times, missed two field goals and an extra point. I don't know if any team has ever won a college football game with that resume. Then I hear that this game is a classic example of how LSU plays - getting short fields by forcing turnovers and big special team plays. That's just not true. LSU has needed more yards per point so far this season than Texas A&M. LSU is relatively weak at forcing turnovers, outside of the top 25 in turnovers per possession this season. But too many people are happy bathing in the preconceived notions and unsubstantiated claims to bother with facts. I am more convinced that Texas A&M is the superior team after the game than I was before.
Saturday, October 20, 2012
CFBTN vs. Vegas, week 8
Vegas and CFBTN are a bit at odds this week. First, the model and Vegas were 9.5 points different for Oregon and Arizona State. Turns out we were both very wrong, but the model was more wrong.
Ignoring the expected blowouts - I really don't care if Utah State beats NMSU by 40 or 32 - there are five games Saturday in which the model and Vegas have very different expectations. I've already said my bit about Kansas State. The leading theory in favor of West Virginia is that Kansas State just won't be able to keep up with the Mountaineers on the scoreboard. Didn't we hear that last week? Kansas State has scored more points per possession this season than West Virginia against tougher competition. KANSAS STATE HAS A BETTER OFFENSE!!! Collin Klein is a better quarterback than Geno Smith, especially against quality defenses.
The model also likes Michigan by a lot. The argument in favor of Michigan is that the Michigan fundamentals are simply better than Michigan State. And Michigan State just lost to Iowa. The argument for Michigan State is that very good defenses have been able to shut Michigan down. The model is projecting Denard to get 6.3 yards per carry. If he gets over 5 then Michigan will win running away.
Finally (because I'm ignoring MWC and Sun Belt games), LSU travels to Texas A&M. This is easily the biggest game of the season for the Aggies. With a win they are legit SEC West (and therefore national title) contenders, Johnny Football can clear a spot on the shelf for a certain bronze statue, and it will really make Aggie fans and players happy. LSU, for the second week in a row, needs the win to stay in the national title hunt. Texas A&M lost by 3 to Florida in their first game with a freshman quarterback and a new coaching staff. LSU lost to that same Florida team by 8 (on the road). The real question here is if LSU actually woke up last week against South Carolina or if LSU will be the same team it was through their first 6 games. The model is betting on the latter.

Friday, October 19, 2012
Penalty Profiles
Scrappy no more, can Vanderbilt bowl?, SEC East/Sun Belt in the balance, and a couple amazing, sensational, dramatic, heartrending, exciting, thrilling clips
[In honor of their win over SMU, I am retiring Tulane Watch 2012, at least until they average less than a yard per carry over the course of an entire game. So you can expect a Tulane Watch 2012 update next week.]
I begin with Kansas State to make one point - Kansas State is not scrappy. In 2011, Kansas State was scrappy. They won two more games than their power rating and schedule said they should have. In 2012 they are again taking advantage of good field position (2nd/18th nationally) and turnovers (11th/8th nationally), and they lead the nation in fewest penalty yards per game, but Kansas State also has the nation's top rated offense. Collin Klein is not a scrappy quarterback. He is an uber-talented physical speciman who also happens to be one the nation's most efficient passers. Unlike LSU, Kansas State runs 70% of the time because they can, not because they have to. The Kansas State defense is only adequate for a team competing for a national championship; strong against the run but potentially vulnerable to a dynamic passing offense (like West Virginia?). So, Kansas State is well-coached, disciplined, smart, etc., etc., but they are no more scrappy than Alabama, another smart, well-coached, disciplined team. Kansas State isn't scrappy. Kansas State is good.
Thursday, October 18, 2012
How mighty are the Ducks?

Alabama is clearly the team to beat this season. The big question is who out there can beat the Tide. Now that LSU has fallen out of favor (although after beating South Carolina by 2 at home they have risen somewhat back into favor), Oregon seems to have emerged as the front runner to become this season's also ran. The model disagrees. Oregon has the nation's 6th best power rating, good enough to make them one of a handful of title contenders, but well short of Alabama status. Oregon has a chance this weekend to separate themselves from the pack.
At Arizona State could be the toughest challenge Oregon faces before a national championship game (the other contenders being @ USC, @ Oregon State and the conference championship game). One statistical knock on Oregon is that, even though they have easily managed their opponents to this point, they haven't played anyone that forced them to prove their mettle. A drubbing of Arizona State would give Oregon a nice shove up the power rankings.
But the other problem is that the model doesn't predict a drubbing. The statistical fundamentals for Oregon - opponent adjusted yards per play and points per possession, for example - even after accounting for reduced performance in non-competitive situtations - just aren't that impressive. Arizona State has a better opponent adjusted yards per play and a better offensive unit rating. The Duck passing game is ineffective, and 5.8 yards per carry for Oregon is disappointing. Oregon is playing solid defense, especially against the pass, but not elite. As a result, even when Vegas is given Oregon a double digit point advantage, the model is calling this game a coin toss. It wouldn't surprise if Thomas had 200 yards on five carries and Oregon won 45-10, but nothing Oregon has done this season suggests that this will happen.
Wednesday, October 17, 2012
Consistency Rating
A central component of the model is a consistency rating used to estimate win probabilities. The lower the value, the more predictable the team has been from week to week.

Running up the score and the Jenkins coefficient
Without getting into the technical details, the Jenkins Coefficient measures whether or not a team scores more (+ value) or less (- value) when they have a big lead. Only 78 teams have had enough plays with a big lead to qualify for a Jenkins coefficient.
Five teams have scored at a higher rate when their lead gets large. East Carolina has been this season's worst offender. At the other end, Utah State significantly reduces its scoring with a lead.

Tuesday, October 16, 2012
CFBTN 101: Probability undefeated
Twelve teams are still undefeated. Three come each from the SEC and Big East. Four teams, Alabama, Kansas State, Rutgers, and Oregon, have better than a 10% chance of staying undefeated. The model still gives Mississippi State a 0% chance of keeping the slate clean (after rounding). Go to "Team: Summary" for more.
CFBTN Rankings Week 8
I have two primary systems for ranking teams. The BPR looks only at the number of wins and losses, who's on the schedule and where. I consider it the best possible BCS-style system for ranking teams. The second is the Hybrid, which combines (thus hybrid) power rankings, BCS-style rankings and a point system for certain outcomes. It is meant to mimic human polls, but without the human element.
Kansas State comes out on top in the BPR for reasons that will make more sense after I discuss the hybrid rankings. Florida's wins over LSU and Texas A&M earn it more credit than any Alabama wins to date. Oklahoma introduces the only loss into the top 10, while undefeated Cincinnati sits at #23.
Alabama has a massive lead on the field in the Hybrid poll. Oklahoma comes in second despite a loss. In short, this is because the model has fallen deeply in love with Oklahoma. It loved Oklahoma at the beginning of the season, lost interest a few weeks in, but now thinks OU is the best thing since Alabama. Texas Tech and Texas A&M are also getting significantly more love in the Hybrid poll than in the national polls, again buoyed by strong power rankings while not dragged down by bad losses. (That West Virginia is ahead of Texas Tech in any polls is unadulterated proof that people are stupid, ignorant, and probably both.)
As always, you can find the complete rankings here.

Monday, October 15, 2012
Week 7's best defensive performances
Adjusting for the strength of the opposition, Oklahoma played the nation's best defense Saturday. TCU and Texas Tech also scored high from the Big 12 as some previously unchecked offenses were finally held in check. Stanford and Notre Dame are in 2nd and 3rd and only .03 points apart. The model does not include overtime possessions, so the goal line stand would have definitely put Notre Dame on top. Kansas at #10 and Houston at #11 is evidence that every dog has their day (although Kansas did not have its day in the sense that the Jayhawks lost. [See the complete table after the break.]

Week 7's best offensive performances
Controlling for the quality of the opponent, the best offensive performance of the weekend came from Arkansas. 4.66 effective points per possession is absurd. Rutgers and A&M fans should be grateful they caught Arkansas a few weeks ago, but the Hogs are rolling again. Oregon State scored 42 points on BYU Saturday, 6x more than Boise State, for example. LSU had the 22nd best showing nationally despite a negative EP3. (see the full table on the other side of the break.)
Sunday, October 14, 2012
Manti Te'o haunts my dreams, stick to your guns, of Cyclones and Chiziks, and Tulane Watch 2012 celebrates
 |
| I like the guy on the left. Not Manti Te'o, further to the left. He's really happy. Te'o looks like he might eat small children |
Saturday, October 13, 2012
CFBTN vs. Vegas
Each week I compare the model's results to an average of Vegas lines because I consider these lines to be an important source of information that I can use to improve my results. I publish this chart each week so readers can see one aspect of that comparison, finding where the model and Vegas disagree.
Interestingly, all four home teams that Vegas likes considerably more than the model were much, much better last year. LSU is the most overrated team in the country. Virginia Tech has lost three of four, adding a second and third order loss to FCS Youngstown State, and they weren't even competitive last week. Houston and Arkansas already hit rock bottom and are starting to dig their way out, but they are still really, really deep. Ironically, on the other side ULM and Rutgers share their most notable win this season, and they might still be underrated.. And I don't really care of Oklahoma State beats Kansas by 20 or 30.
Friday, October 12, 2012
Semifinal in the B1G, Beavers v. Cougars, losing in the SEC, Lubbock and the Death Star, and Tulane Watch 2012
The winner of Purdue and Wisconsin this weekend should represent their division (the name of which I am still boycotting) for the Big 10 championship. Illinois and Indiana are each projected to fewer than 2 conference wins and Ohio State and Penn State are ineligible. That leaves Purdue and Wisconsin. Like UCLA a year ago, they have also already demonstrated that they would finish in the bottom half of the other division (whose name demonstrates an arrogance unwarranted by the irrelevance of the conference). The model is giving Wisconsin and Purdue equal odds, so right now that division (the one that rhymes with "cheaters") is a coin toss.
CFBTN 101: Points per possession
Good offenses don't just score a lot of points; they make the most of their opportunities. With the range of tempos teams play at these days - some slow, some fast, some frenetically, absurdly fast - games vary in the number of opportunities teams have to score. To account for that, it is important to evaluate performances by the successes per opportunities, or points per possession.
In "Team: Rank 2" I list average points per possession (scored and allowed) for every team in college football. The top five teams nationally by points per possession are all in the Big 12. These five and Louisiana Tech average half a touchdown or more per possession, so that when any of them kick a field goal it actually brings down their season average. Eight teams average more than five times as many points per possession as Tulane (.67).
In "Team: Rank 2" I list average points per possession (scored and allowed) for every team in college football. The top five teams nationally by points per possession are all in the Big 12. These five and Louisiana Tech average half a touchdown or more per possession, so that when any of them kick a field goal it actually brings down their season average. Eight teams average more than five times as many points per possession as Tulane (.67).
Thursday, October 11, 2012
Blackwell's EPA: Running backs
[These statistics do not include the most recent weeks games.] Briefly, De'Anthony Thomas is still the nation's most dangerous runner. More impressive than his .83 NEPA/PP and his .20 NEPA/PP lead on the rest of the country is his .64 NEPA/PP lead on teammate Kenjon Barner. The gap between Thomas and Barner is larger than the gap between Orwin Smith, the nation's second most efficient running back, and the FBS average. And Barner is no slouch.
Blackwell's EPA: Quarterbacks
[These statistics do not include the most recent week's games.] Geno Smith has a healthy margin on all other QBs by EPA and NEPA per game and per play. Nick Florence jumps to #2 in the per game categories after he and Smith put up absurd numbers against each other. Johnny Manziel moves into the 3rd spot, passing Tech's Doege, after slashing Arkansas for more than 500 yards of total offense.
Week 6 EP3+O and EP3+D
If this is your first time hearing about the EP3+, I suggest you check out my brief introduction to the metric. It's rad.
Moving on, Baylor leads the nation by EP3+O. This essentially means that Baylor, at this point in the season, has the best offense in the nation. Baylor is 3rd in the standard offensive unit ratings used in the model which suggests that its 110th ranked defense is holding the Bears back some. Shocker.
Wednesday, October 10, 2012
College football's sharing leaders

So today I honor those teams that have been very generous with the football during a game and still won. This season teams have turned the ball over at least four times and still won 18 times. Nine of those came against FCS opponents (three of whom are pretending to be FBS programs).
Maryland started the season 2-0 despite turning the ball over eight times in those games. Texas A&M overcame six to beat Ole Miss (who had a couple doozies of their own in that game). But the most impressive performance comes from UCLA, who turned it over five times and still beat Houston by 31 (Houston had six turnovers).
Who got better, who got worse, 2011 to 2012
This is a critical point in the season for a statistical analyst because no longer do I rely on results from last season to help me evaluate teams and performances this season. The sample size is finally large enough (and I do love large sample sizes). Early in the season we preview games by looking at how teams finished last season and making minor adjustments for graduating seniors and incoming freshman. But now we can approach the season with a clean slate, rate teams based on their performance this season alone, and then compare that performance to last season's.
Tuesday, October 9, 2012
CFBTN 101: Average Field Position
I recently added average field position on the team summary page on the 4th panel (I refer to it internally as the "more stats" panel; if I were Google I'd call it "Dreamsicle"). I do not yet offer compiled average field positions as a permanent feature of the site, so I thought the addition of AFP to the team summary page warranted a celebration in the form of a blog post.
AFP is measured in yards to the goal line. I track the team's AFP and their opponent's AFP. A team's AFP is like golf, smaller numbers are better. For the opponent's AFP bigger numbers are better. If you need me to explain why that is you're on the wrong site.
AFP is measured in yards to the goal line. I track the team's AFP and their opponent's AFP. A team's AFP is like golf, smaller numbers are better. For the opponent's AFP bigger numbers are better. If you need me to explain why that is you're on the wrong site.
Week 6 BPR Poll

The top team in the BPR is Florida. With wins over Texas A&M, Tennessee, and Kentucky . . . and some team called Louisiana State, Florida has the nation's most impressive resume. Kansas State, West Virginia and South Carolina sport wins over Oklahoma, Texas and Georgia, respectively.
A few teams appear much higher in the BPR than in other national polls. Western Kentucky and Ohio, in particular, get a lot more love because they are bolstered by undefeated records (Alabama doesn't count). The BPR is less impressed, though, with Oregon's wins over Arizona and Washington (but a win over Arizona State would be a huge boost).
Monday, October 8, 2012
Quantifying week 6 performances
The EP3 allows me to measure the point value of a drive, both in terms of points scored and field position. The EP3+ adjusts the average EP3 over the course of the season for the quality of the opposition. Using these two data points we can compare offensive and defensive performances across games (Perf-O and Perf-D).
By this metric, the most impressive offensive performance this weekend came from Arizona. In route to their overtime loss, Arizona managed 2.5 effective points per possession. This measures out to an opponent adjusted 2.7 effective points, nearly a half point better than any other team. Vanderbilt scored 6th in Perf-O despite actually having a negative EP3 for the game. Missouri is among the nation's best by EP3+D.
By this metric, the most impressive offensive performance this weekend came from Arizona. In route to their overtime loss, Arizona managed 2.5 effective points per possession. This measures out to an opponent adjusted 2.7 effective points, nearly a half point better than any other team. Vanderbilt scored 6th in Perf-O despite actually having a negative EP3 for the game. Missouri is among the nation's best by EP3+D.
Week 6 winners and losers, BYU gets defensive, and the Green tidal Wave
 |
| I'm not even sure how this happens (Kim Klement, US Presswire) |
1) Florida (South Carolina honorable mention) - If you pretend like you care about what teams do on the field, I don't know how you would have anyone but Florida at #1. Regardless, Florida controls its own destiny. With wins against what will probably be #2 and #3 in the West under its belt, Florida now gets South Carolina at home a week after the Gamecocks travel to LSU. (P.S. I was absolutely right about Florida/LSU.)
2) Kansas State (West Virginia, Oregon honorable mention) - Two hurdles to the top of the polls just got cleared away (Florida State and LSU). Plus, Kansas State already beat Oklahoma, who seemed to turn the corner this weekend. (P.S. I was so very, very, very wrong about OU/Tech.)
Sunday, October 7, 2012
Remodeling CFBTN
I am constantly adjusting the model that underlies the predictions and analysis on CFBTN. From time to time the model gets more than a tweak. As I get access to new data or develop a new approach, I run a few tests to see if they will make the model more robust and more efficient. If so I integrate them into the model. If not, they are discarded in the dust bin of history.
Saturday, October 6, 2012
CFBTN vs. Vegas: Week 6 picks
There are five games this week where the model and Vegas disagree by more than a touchdown. I've already talked about LSU and Florida, and I think the model has the right idea on this one. This is not 2011's LSU team, but the public has not yet accepted what the underlying statistics are screaming. I'm not sure if the model likes USC less or Utah more than most others (probably a little of both). Utah will come in with the same essential game plan as Stanford, and that worked pretty well, but it is still hard to defend the model's pick after last week. The model LOVES Texas Tech, and playing in Lubbock with the better quaterback and better defense (according to the underlying statistics), what's not to love. Twelve points is probably the biggest spread between the model and Vegas we will see the rest of the season.
Friday, October 5, 2012
Reviewing CFBTN's picks
Each dot below represents one of the 135 games in weeks 2, 4 and 5 with Vegas lines (I am not including weeks 1 and 3 because I didn't download those lines in advance). The bottom axis is the distance between the CFBTN prediction and the real outcome, and the vertical axis is same but for the Vegas line. In general, those games that the model missed were the same games that Vegas missed; the model and Vegas are often thinking along the same lines. There is a slight tendency for Vegas to be closer when the two disagree wildly, and vice versa. On the whole, the model's performance is more than admirable considering it has never watched game film, it treats injuries as binomial outcomes - in or out - and it doesn't have a scouting report on the backup, and it doesn't know what Kyle Field is like under the lights, all things you would think would be important for picking games.
Previewing the battle for the SEC east, the performance implosion in Auburn, kickers (good, bad, and really bad), and, of course, Tulane Watch 2012
Georgia travels to South Carolina for one of three games that will decide the SEC East (the other two involve these teams and Florida). This game has become infinitely more important because Bobby Petrino likes younger women on bikes he can't handle, and because the Honey Badger likes to ingest things that make him feel happy. Georgia's advantage over South Carolina in the division was supposed to come from scheduling - South Carolina plays Arkansas and LSU while Georgia does not. But Arkansas is the worst team in the SEC (literally one spot below Kentucky in the power rankings) and LSU is downright mediocre. Georgia might have to earn its way to Atlanta.
Speaking of Arkansas, the worst team in the SEC, they play Auburn this weekend. This game is significant because 1) these programs have generated elite products recently, 2) this game could represent the worst football in the country when Auburn has the ball - just terrible - and 3) item #2 could lead to a violation of the fundamental laws of physics. Let me explain: Arkansas has allowed 349 passing yards per game, 121st in the country; Auburn throws for 145 yards per game, 118th nationally. If Auburn does throw a pass, it just might end up suspended in midair, incapable of falling incomplete on account of Arkansas being so bad they couldn't cover Yellow Submarine, but incapable of being caught by an Auburn wide receiver (because Frazier couldn't hit the broadside of a Yellow Submarine). The fabric of space and time could be torn asunder.
Speaking of Arkansas, the worst team in the SEC, they play Auburn this weekend. This game is significant because 1) these programs have generated elite products recently, 2) this game could represent the worst football in the country when Auburn has the ball - just terrible - and 3) item #2 could lead to a violation of the fundamental laws of physics. Let me explain: Arkansas has allowed 349 passing yards per game, 121st in the country; Auburn throws for 145 yards per game, 118th nationally. If Auburn does throw a pass, it just might end up suspended in midair, incapable of falling incomplete on account of Arkansas being so bad they couldn't cover Yellow Submarine, but incapable of being caught by an Auburn wide receiver (because Frazier couldn't hit the broadside of a Yellow Submarine). The fabric of space and time could be torn asunder.
Thursday, October 4, 2012
Blackwell's EPA: week 4 QBs, the bottom 15
It is hard to know how much of Newton Morgan's performance was Newton Morgan and how much was Florida, but a NEPA/PP close to -1 is pretty remarkable. Even worse than Brandon Allen, and Brandon Allen was bad. That James Franklin still has such a prominent position at the bottom of the EPA rankings is more than surprising, and it does not bode well for Missouri.
Blackwell's EPA: week 4 RBs
De'Anthony Thomas is still the nation's productive back per play, but he has fallen from 1.4 NEPA/PP to .8. Miami's Duke Johnson made the jump from 5th to 1st with a big week 4 against North Carolina State.
Blackwell's EPA: week 4 QBs
Through the first four weeks of the season, Texas Tech's Seth Doege continues to lead the nation in EPA and NEPA despite not playing in week 4. Doege also passed TCU's Casey Pachall in EPA and NEPA per play after the TCU quaterback added only 14.6 expected points on 41 plays against Virginia. But Doege's throne is incredibly hot after Tech managed only 24 points against Iowa State and Geno Smith had a game against Baylor in which his passing is best measured in miles, not yards.
Wednesday, October 3, 2012
CFBTN 101: Advanced RB statistics
Chris Thompson is averaging 8.8 yards per carry. That's good. That's really good. In fact, its the best among all players with a significant number of carries. But it gets even better. When we adjust Chris Thompson for the strength of the run defenses he has faced, 8.8 yards per carry rises to 9.2 yards.
Is LSU good?
 |
| Will the real LSU please stand up? / AP |
LSU destroyed Washington. I could quote stats from the game to prove that point, but you should really just go watch the film. LSU destroyed Washington, and then Washington turns around and beats Stanford. Then LSU beats a bad Auburn team by 2 after trailing most of the game and beats Towson by two scores. Towson. Rarely does a team's performance vary so wildly from week to week.
So I think it is fair to ask: Is LSU good?
Tuesday, October 2, 2012
CFBTN 101: Heisman Rankings
Humans are irrational, and when we let humans decide things we get irrational answers. That's okay for prom queen, student body president, or congress, but when we let our irrational biases influence Heisman voting, I get upset.
The Stat-wise Heisman ranking quantifies the rationale we point to for discriminating between worthy Heisman candidates. Among the qualities considered are: Does the player produce? Does the player produce against quality opponents? Does the player produce in big games? Does the player fail to produce in big losses? Is the player leading (playing quarterback or running back) a good team? Qualities the model does not consider: did the program send me a nice booklet extolling the players best qualities? Does he give good interviews/is he charismatic? Did he strike a Heisman after a punt return touchdown against Ohio St? Is he an underclassman? Does he run circles around the Arkansas defense before walking into the endzone? (Because, honestly, who doesn't do that?)
Correcting Tempo
Until recently, Florida State was listed as playing at the slowest tempo in college football. This was because the model failed to account for the unofficial mercy rule being applied in the Savannah State game. In correcting that problem, I took the opportunity to reformulate the tempo metric. Like before, tempo estimates how quickly a team runs plays in real time, not game time, but now it is specifically the number of plays in 15 minutes of real time. For example, a tempo of 30 means that a team would run 30 plays every 15 actual minutes, or 2 plays a minute.
Ranking kickers in college football (aka the Penn State kicking game is really that bad)
We can get a better picture of a kicker's performance if we evaluate each field goal attempt by the distance. My approach here is to use the average accuracy of kickers from each distance, convert that into points (the field goal attempt is worth 1.5 points if kickers make the field goal 50% of the time), and then subtract that from the actual points earned on each individual kick.
By this metric, Northwestern has benefited the most from the kicking game. Jeff Budzien is 11 for 11 on the season, including 4 kicks over 40 yards. He has been worth 9.7 points to his team (versus the average FBS kicker). Tulane's Cairo Santos has added an astounding 1.3 points per kick on his 4 attempts (all four over 30 yards, two over 40 and one over 50 yards). To put this in perspective, 1/6th of Tulane's 32 points have come from Santos being better than other kickers; from just four plays he is clearly the team's offensive MVP.
By this metric, Northwestern has benefited the most from the kicking game. Jeff Budzien is 11 for 11 on the season, including 4 kicks over 40 yards. He has been worth 9.7 points to his team (versus the average FBS kicker). Tulane's Cairo Santos has added an astounding 1.3 points per kick on his 4 attempts (all four over 30 yards, two over 40 and one over 50 yards). To put this in perspective, 1/6th of Tulane's 32 points have come from Santos being better than other kickers; from just four plays he is clearly the team's offensive MVP.
Monday, October 1, 2012
Quantifying the best performances of week 5
The EP3 is a per possession performance metric. Earlier in the year I reported raw EP3s, which measured how many effective points a team added per possession. Now with five weeks of data we can start talking about the EP3+, which adjusts the EP3 for the quality of the opponent. The values below measure how well a team performed given the quality of the opposition they faced.
For example, according to the EP3+ Oklahoma St was the week's best offense. Despite scoring only 36 points, compared to 70 for West Virginia and 63 for Baylor, Oklahoma St scored those points against a much better defense and in fewer possessions. Baylor and West Virginia are 3rd and 4th, though, followed by former Big 12 mate Texas A&M.
Reviewing Tulane Watch 2012, 3184 points, and more fun with the transitive property
Tulane Watch 2012. Tulane did not disappoint in week 5. The Green Wave managed a whopping -9 rushing yards against ULM to bring their season average to 5 rushing yards per game and .2 yards per carry. They also managed 160 yards on 45 pass attempts. Tulane is now firmly in last place nationally in rushing yards per game and per attempt, points and yards per game and points per possession. They fell 30 spots to 94th in completion percentage and are 123rd in yards per completion. On the other side, they are allowing 43 points per game. Tulane Watch 2012 marches on.
FBS teams in week 5 scored 3,184 points, the point equivalent of 455 touchdowns. In 51 games involving two FBS teams, six teams lost despite scoring 40 or more points and 12 lost despite scoring 30 or more. Ten teams gained over 500 yards and lost. Five rushed for more than 220 yards and lost. Arkansas had 515 yards of offense and lost by 48.
But one game surpassed them all. Baylor and West Virginia scored 133 total points. Last week the model projected this game to over 900 total passing yards. West Virginia almost did that by themselves. Together they managed over 1,200 passing yards and over 1,500 total yards. Two receivers had more than 300 receiving yards. Sources tell me that the two teams agreed just to let the defensive players sit this one out altogether.
| This remarkable and controversial photograph appears to capture a Baylor tackle in progress. Skeptics argue that the Baylor tackle is nothing more than a myth |
But one game surpassed them all. Baylor and West Virginia scored 133 total points. Last week the model projected this game to over 900 total passing yards. West Virginia almost did that by themselves. Together they managed over 1,200 passing yards and over 1,500 total yards. Two receivers had more than 300 receiving yards. Sources tell me that the two teams agreed just to let the defensive players sit this one out altogether.
Subscribe to:
Posts (Atom)